
Tokenomics and the future of marketing
A first-principles field guide for measurement and MarTech practitioners
Published:
8 minute read
Contributor: Fraser Gray-Smith
TL;DR
- Metered pricing is replacing seat-based pricing. Vendor costs now scale with usage, making forecasting harder and invoice surprises more common.
- One customer session can be billed five different ways. Events, rows, MAU/profiles, compute credits, and tokens can grow independently even when business performance doesn’t change.
- Token costs aren’t a clean proxy for value. Tokens aren’t words, output tokens often cost 3–5x input tokens, and agentic/retrieval workflows can multiply usage quickly.
- Cost is becoming a governance problem, not just a math problem. Leaders need clear ownership, auditability, and a way to translate technical consumption into business value.
- Normalization and guardrails are the practical fix. Model cost as business driver × technical intensity × unit price, then apply controls like right-sized models, caching, batching, and smarter contract terms.
Why your MarTech and AI costs are getting harder to forecast
$500 million: that’s the AI bill one global enterprise reportedly racked up in a single month after employees were given unrestricted access and no spending caps, according to Yahoo Finance. It’s an extreme example, but it points to a challenge marketing leaders are starting to face: as AI becomes part of the MarTech stack, costs can grow in ways that are difficult to predict. Global MarTech spending is projected to cross $1 trillion in 2026, according to Statista.
For leaders planning budgets, renewing platform contracts, or deciding whether to scale an AI pilot, the question is no longer just how quickly to adopt AI. It’s how to forecast and govern the cost as usage grows. A single customer session can trigger charges across events, data rows, active profiles, compute, and AI tokens—and each meter can move at a different pace. Understanding those five meters, then connecting them to business activity leaders already track, can make costs easier to explain and plan for. This brings us to the building block at the very bottom: tokens. What they are, why they add up the way they do, how to optimize for them, and ultimately, how to price for them.
“Tokenomics” already had a definition before marketing borrowed it. In cryptocurrency, it describes the rules governing a digital token’s supply, issuance, and distribution: how many tokens exist, how new ones enter circulation, and what keeps people holding rather than selling them. That’s a real discipline, with mechanics like staking, vesting schedules, and burn rates.
Marketing and MarTech face a different kind of tokenomics problem: vendors price products using different units of consumption. Your CDP may charge by data volume, an engagement platform by active profiles, and an AI service by tokens. Those units don’t convert neatly into one another, making it harder to forecast how the bill will change as the business grows.
The frustration is legitimate. The fix is not a conversion table
Every finance team wants a spreadsheet that converts tokens to events to MAU like a currency exchange booth. It doesn’t exist, and building one is where these projects go to die. Three things are true at once:
- The units are real. Each meter tracks something the vendor is paying for.
- They aren’t comparable. There’s no exchange rate between a token, an event, and a monthly active user.
- They don’t grow together. One business change can move three meters in three different directions. Ship a feature, and compute rises, MAU stays flat, and delivered outcomes might drop.
The forecasting problem is non-correlated growth, not unfamiliar unit names. Once that reframe lands, the ask changes from “give me a conversion table” to “help me understand why these numbers move independently.”
Why meters replaced seats
For years, software pricing rested on a simple assumption: it cost almost nothing to serve one more user. Whether someone opened the tool once a day or fifty times, the vendor’s cost to serve barely moved, but AI inference doesn’t behave that way.
Every call burns real compute, so the vendor’s cost to serve scales with usage and pricing follows.
|
THE OLD MODEL Per seat |
THE CONSUMPTION MODEL Per unit of work |
|---|---|
|
|
When a meter tracks both vendor cost and customer value, pricing remains forecastable. When the two diverge, forecasting breaks down, and no one notices until the invoice arrives.
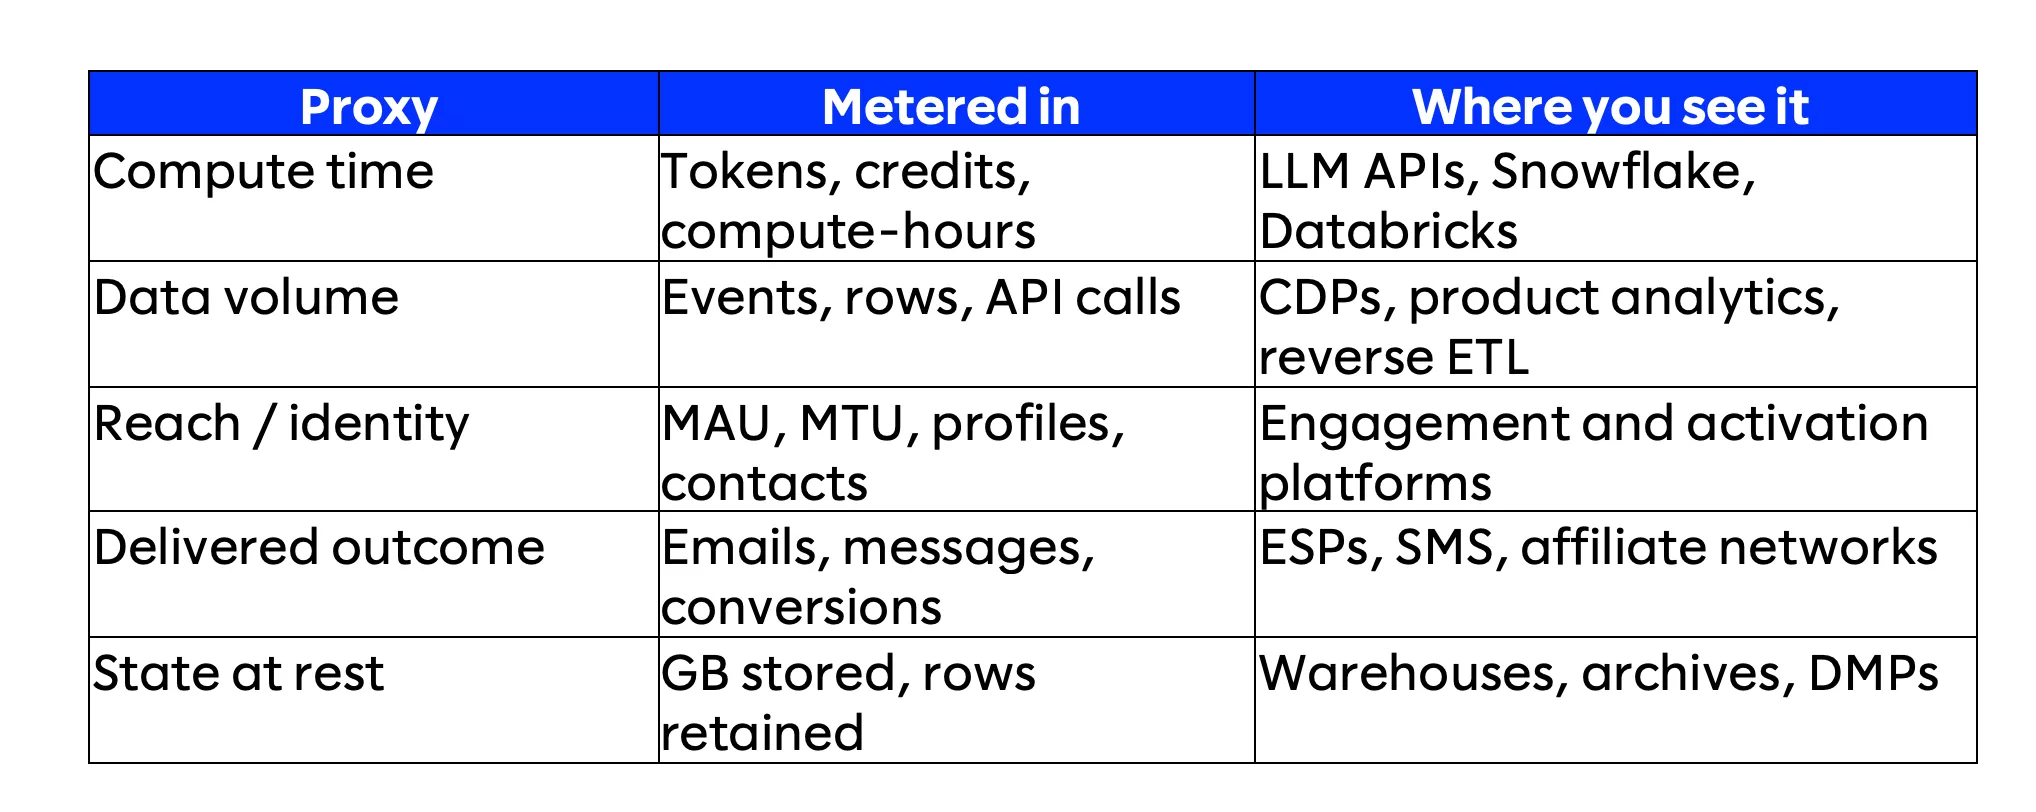
Every consumption currency is one of five proxies
Vendors haven’t each invented a new economic model. They’ve picked a proxy from a short list, and once the proxy is identified, the pricing logic becomes easier to understand.
A token is not a word
A tokenizer splits text into sub-word units drawn from a fixed vocabulary. Common words stay whole; unusual ones fragment. In ordinary English prose that works out to roughly four characters, or about 0.75 words, per token. Code, JSON and non-English text can run two to three times denser. Token count is a property of the text and the vendor’s tokenizer, not a property of the information itself, which means the same document produces a different token count at every vendor.
Input and output are different products. Output is generated token by token and typically prices at three to five times the input rate. In this case, budgeting by workload type matters more than tracking one blended number: summarisation is input-dominated, classification and routing are the cheapest shape by far, content generation is output-dominated, and agentic workflows compound all three by repeating the loop many times per task.
Vendor choice adds a second layer of variance. The same task given to two LLM models may consume a different number of tokens, even if the output is identical. Each vendor will also charge a different price-per-token, making comparability difficult.
To keep the comparison honest: normalise to cost per 1,000 words or per completed task rather than cost per token and test the estimate on your own content rather than a generic benchmark.
The multipliers nobody puts in the spreadsheet
These are some of the reasons AI forecasts can miss by a wide margin. Context may be resent with every turn, so cost grows with conversation length. Retrieval adds material to the input, so a short question can trigger a much larger call.
A single agent action can trigger many model roundtrips. Some billed processing, such as internal reasoning, may not appear on screen. Behind the scenes, extra checks and safeguards can add cost on top of the task itself.
Slalom's Global AI Insights Survey puts a number on the investment trend: 91% of leaders plan to increase AI investment in 2026, yet only 39% track ROI. Spend is accelerating faster than the ability to measure what it’s buying. The same survey found gaps in oversight: just 50% of organizations run audits or governance reviews on their AI systems. When usage isn’t visible across the stack, token-level waste may not be registered.
One session, five meters, five growth rates
Consider a marketing team that adds two new destinations to its activation stack. Customer sessions stay steady, but the rows moving through reverse ETL double. Later, the team adds an AI agent to help prepare campaign content; token use rises sharply while campaign volume and audience size remain flat. The business hasn’t grown, but several meters have moved, and each needs a different explanation in the forecast.
Those five meters don’t share a shape either. Some are linear: doubling usage doubles cost, so extrapolation is relatively straightforward. Some are exponential, where cost per unit rises with scale and a straight-line forecast understates the total. Others ratchet, where a single usage peak resets the floor for the rest of the term. Mixed-shape meters can’t be forecast by growing last year’s spend by a flat percentage.
The bill is becoming a governance problem, not just a math problem
This isn’t staying a MarTech-team problem. Across the organizations we work with, AI cost has become the fastest-growing, least-governed line in the enterprise budget. We have observed:
- Meter ownership is unclear, so consumption and spend are hard to connect to a team or business activity
- Teams optimize one layer and unintentionally increase consumption elsewhere
- Rate-card thresholds and usage ratchets create surprises alongside usage growth
Managing these patterns is a shared operating responsibility. Marketing operations can connect usage to campaigns and customer activity; finance can own the forecast, variance review, and commitments; and the data or AI platform team can explain technical intensity, model choices, and meter data. A monthly forecast review can cover cost per business driver, actual-versus-forecast variance, workload mix, tier thresholds, and any usage ratchets.
Before renewal, the group can audit the vendor’s metered data, confirm how usage peaks affect future charges, and revisit commitments and overage terms. That gives marketing, technology, and finance leaders a shared basis for deciding what to optimize, fund, and negotiate.
The Linux Foundation launched a dedicated Tokenomics Foundation in August 2026 to develop open, vendor-neutral frameworks and practices for measuring AI costs and value.
For a MarTech practitioner, the CFO conversation is coming whether the stack is ready for it or not. Naming the proxy, showing the workload shape and quoting a cost-per-unit-of-business-value figure is what turns that conversation from an audit into a negotiation.
Normalise to cost per unit of business value
Every layer of a composable stack can be expressed the same way:
Cost = Business driver × Technical intensity × Unit price.
The business driver is activity leaders already forecast, such as sessions, orders, campaigns, or active customers. Technical intensity is the work each activity creates, such as events per session or tokens per interaction. Unit price is the vendor’s rate card, including tiers, commitments, and overage.
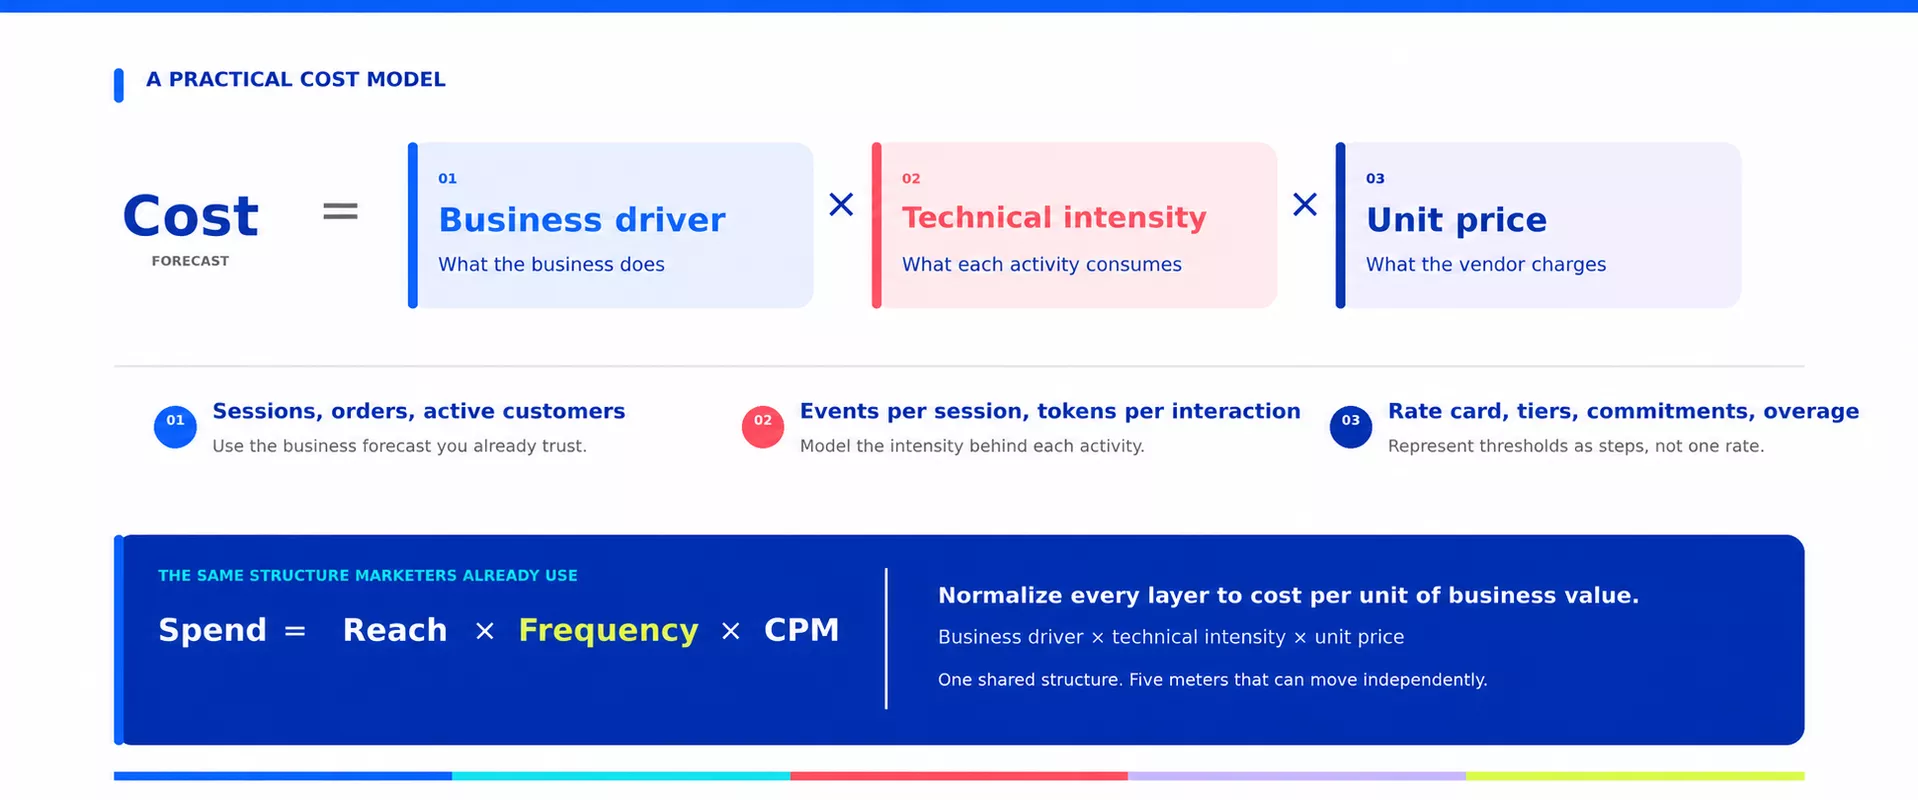
This follows the same logic marketers use in media planning: Spend = Reach × Frequency × CPM.
Forecasts often go wrong when they assume each session creates the same amount of processing or treat a tiered rate card as one flat price. Track technical intensity and cost variance in the monthly forecast review; revisit commitments, tier thresholds, and overage terms during annual planning and renewal negotiations.
Expressing each layer as cost per 1,000 sessions, or another business driver that fits the workload, makes the costs easier to compare without pretending the underlying meters are interchangeable.
Reduce cost without reducing useful work
Cost control should preserve useful work while reducing avoidable consumption. Start with the workload: route each task to a model sized for its needs, cache stable context where the prompt design allows it, and use batch processing for work that doesn’t need an immediate response.
Prompt caching bills repeated, stable context at a steep discount on subsequent calls. It works best when stable context sits first in the prompt, so it’s a prompt-design discipline, not just a toggle. Batch processing runs non-user-facing workloads, such as enrichment, scoring, classification, and backfills, asynchronously at a lower rate, trading latency for cost. If neither is built into the architecture, the quoted run rate may be higher than it needs to be.
Five questions before you sign anything metered
- Define the unit in writing. Does a dormant profile count as an MAU? Does a failed call bill?
- Demand the metered data, not just the invoice. A number you can’t decompose is a number you can’t audit.
- Ask whether one usage peak sets the floor, and when the meter resets.
- Model overage as a multiple, separate from the committed unit price.
- Check whether unused commitment rolls over or evaporates.
The goal isn’t to make every meter equivalent. It’s to make each one explainable: what business activity drives it, what technical work it creates, and how the contract prices that work. With shared ownership, a monthly view of unit economics, and a pre-renewal audit, marketing, finance, and technology leaders can turn usage data into better forecasts and more confident investment decisions.