MICHIGAN STATE POLICE
Creating a dynamic crime dashboard for safer communities

At a glance
Slalom partnered with the Michigan State Police to support one of its goals—to maintain public trust—by creating an up-to-date crime data dashboard and upskilling internal teams so they can find new, data-driven ways to support the community.
Impact
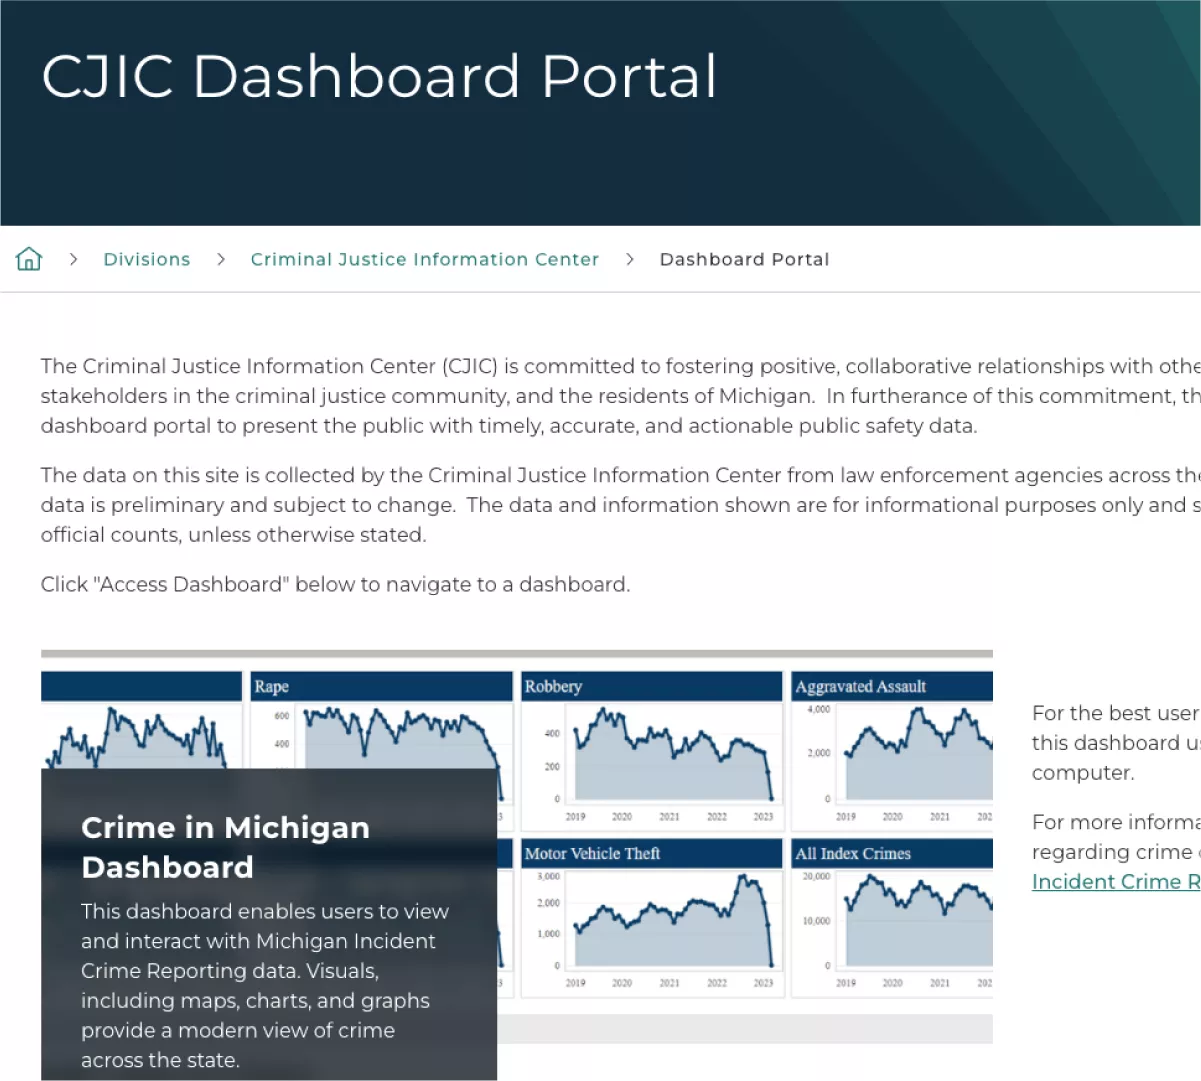
Michigan’s Crime Dashboard empowers better-informed public safety decisions using insights based on the most current data available. Stakeholders and residents can better understand regional public safety trends across jurisdictions.
Industry
State, provincial & local government
Key Technologies / Platforms
- Tableau
Key Services
Harnessing the value of public safety insights
Michigan State Police (MSP) is a leader and partner in law enforcement and public safety, with a highly trained, full-service force that is mobile, flexible, and responsive to emerging public safety needs across Michigan. Because public trust and support are essential to good community policing strategies and accountability, MSP is committed to making information about its operations and administration easily accessible to the public.
Michigan is one of just two states in the entire country where emergency management falls within the purview of the state police. For Michelle Kleckler—an 11-year veteran in emergency management—those two very different worlds came together when, on her first day as director of Michigan’s Criminal Justice Information Center, she was asked to create an all-new crime dashboard.
Historically, MSP had relied on manual processes to manage and report its legally mandated Crime in Michigan Annual Report. Creating the report required about six months of tedious work from their teams each year—writing, rewriting, and analyzing data and summary language from agencies all over the state. The final product of all that hard work was a very long PDF report—static, out-of-date, and therefore unhelpful to the people and agencies who needed its data. “I decided I never wanted to review another one of those again,” says Kleckler.
Then, at a time when communities began demanding visibility into public safety data, Slalom’s Detroit team reached out to MSP to offer support and expertise. Our initial engagement was not about pushing solutions but about listening and learning.

Building a public safety experience for the people who need it
Our Slalom team spent two years deeply embedded within the MSP Criminal Justice Information Center, immersing ourselves in its processes, understanding how it collects and manages data, and exploring the broader impact of public safety data across Michigan. Our approach was fundamentally human-centered.
The early phases of our work involved persona building and discovery, as Slalom facilitated conversations with stakeholders to ensure that the dashboards would deliver the specific information that each agency required. We also asked critical questions about the people involved and existing processes in place, ensuring that our work was tailored to the unique needs of MSP and the communities it serves.
Following a monthlong discovery process, we collaborated with MSP to automate the tedious, time-consuming manual processes required to produce the annual report. The logic for crime counting is very complex, so we first addressed three key challenges—outdated reporting, limited accessibility, and data management inefficiencies. As with most projects that transform manual processes into automated ones, scrubbing the data was a critical first step. Eric Fowler, who manages data strategy and governance at MSP, had already begun rewriting the logic that supports the new dashboard—thousands of lines of SQL code— transforming the raw data into the tables needed to support the dashboard.
As we looked for ways to not only provide data but make it insightful and actionable, the depth of our “bold vision explorations” revealed unexpected insights for everyone. Scott Smith, a director at Slalom, says, “We spent quite a bit of time asking troopers and commanders about their work. And what we discovered was just how open they were to it. They were very interested in being able to talk data across different districts, posts, geographies—all to get a better, less-siloed perspective. As a data strategist, I was excited to help MSP think beyond their current construct and move not just one foot away but a thousand feet away from where they were and to then help translate that vision into reality.”
Slalom and MSP began thinking beyond what was necessary and exploring what was possible—additional functionality, an intuitive look and feel, and consistent, carefully considered language that would ensure that members of the public could easily understand exactly what the information they were viewing meant.
Minimizing effort, maximizing value
For the state of Michigan, the new Crime Dashboard enables better-informed public safety decisions based on current, interactive data and insights. Stakeholders and residents can better understand their data and regional public safety trends across jurisdictions using intuitive and dynamic tables, charts, and graphs. The launch of the dashboard represents significant community engagement, accessibility, and data sharing. By replacing static reports with interactive, customizable dashboards, MSP is meeting the needs of diverse stakeholders, including public users, researchers and academics, and government agencies and media.
For Kleckler, the value of the project is multifaceted. For too long, the team was limited by the tools and training they had. This work was an opportunity to expand their skills using the Tableau tools they’d asked for, and to help them discover new data-driven ways to support their community.
So how will the crime dashboard evolve from here? Kleckler says, “The crime dashboard served as a blueprint for what we want to do in other areas across the division. It’s the first dataset that went into our data lakehouse and the first dashboard available to the public. We now have a series of dashboards—internal, external, and public. As a result, we’ve been able to use those dashboards rather than create a massive annual report that took my team hours to produce. It’s really transitioned our vision into concrete capabilities and proven we can go everywhere. We are replicating this process with other key datasets such as statewide traffic crash data and automatic set-aside numbers.”


