Care
Using data to support women in crisis
At a glance
When CARE created the Women Respond program to provide humanitarian relief around the world and needed modern data and analytics capabilities to provide global insights, it invited Slalom and Microsoft to join the effort.
Impact
Slalom and Microsoft partnered to develop a modern data solution that helps the organization deliver exactly what’s needed to those who need it most.
Key Services
Industry
Nonprofit & philantropy
Key Technologies / Platforms
- Power BI
- Azure Data Warehouse
- Azure Synapse
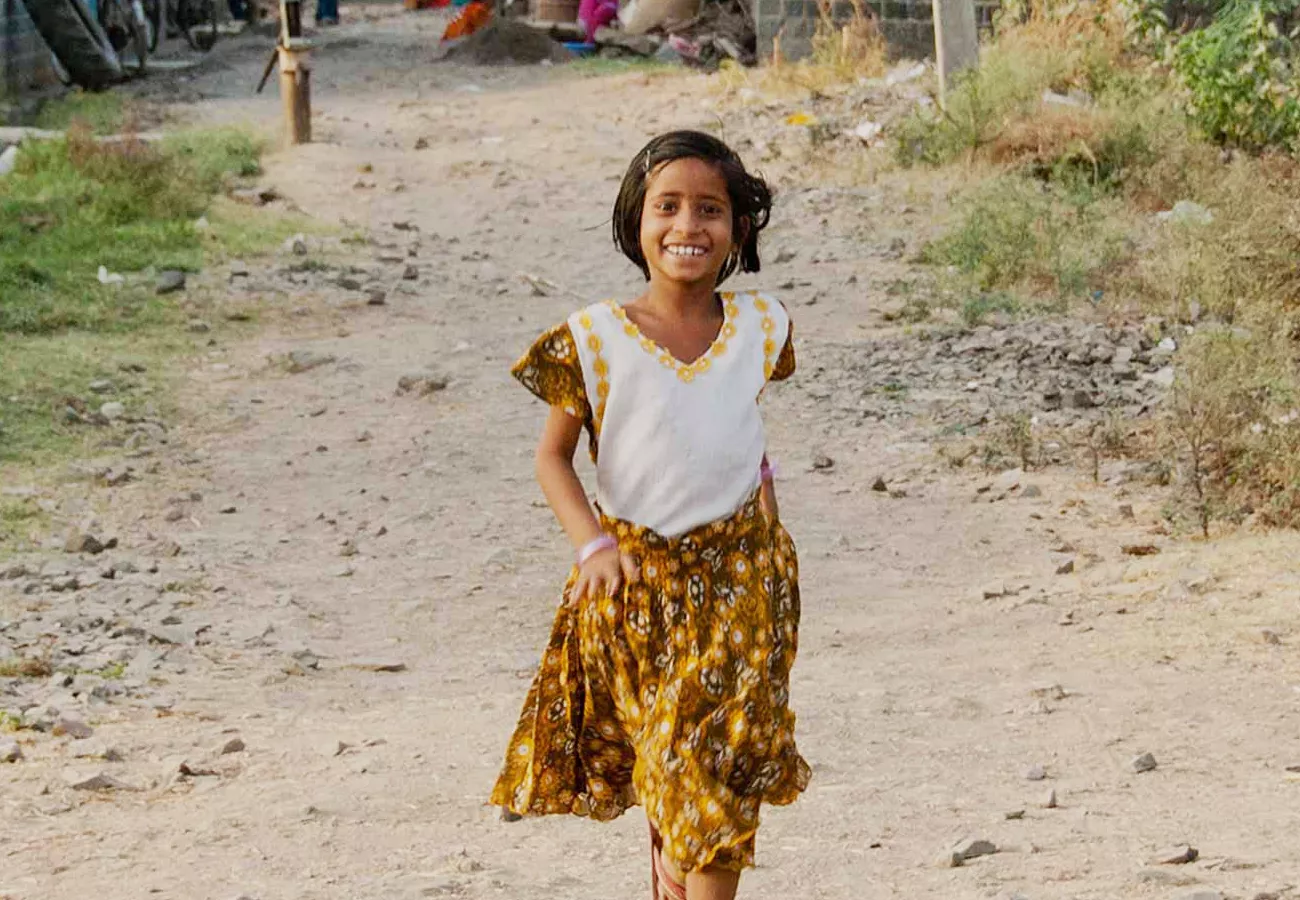
Showing the world what happens when we lift up women and girls
The scope of CARE’s humanitarian work is staggering: 100 countries, 1,300 programs, 90 million people. With a mission to save lives, defeat poverty, and achieve social justice, the organization provides women and girls with healthcare, advocacy, food, water, shelter, hygiene, and more. CARE’s work recognizes that these groups are differently and disproportionately impacted by any crisis—whether it’s a natural disaster or a military conflict.
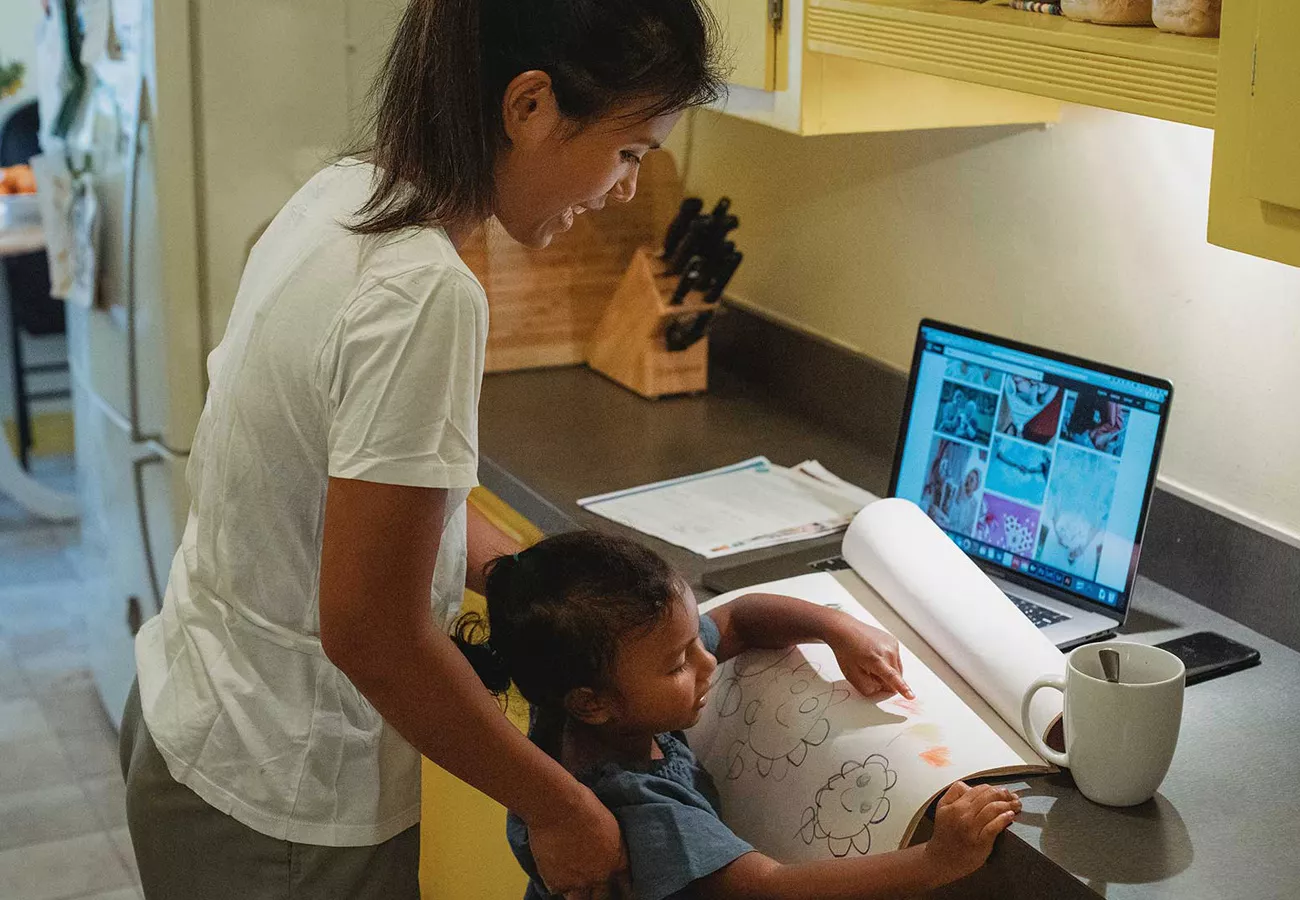
COVID-19 added yet another layer of complexity to women’s situations. Not only were they losing lives and livelihoods, they were losing rights and experiencing increased domestic violence. CARE created the Women Respond initiative to provide support and learn how women are leading through crisis—but in order to do it effectively, the organization needed data.
With no modern precedent for the pandemic, there was nowhere to turn for information. CARE conducted surveys on the ground, interviewing people in displacement camps, dense urban areas, and rural villages. Outreach took place via automated phone system, texts, tablets, and paper notebooks. Each member country tailored its questions to specific communities, and responses came back in so many languages and formats they were impossible to compare or aggregate.
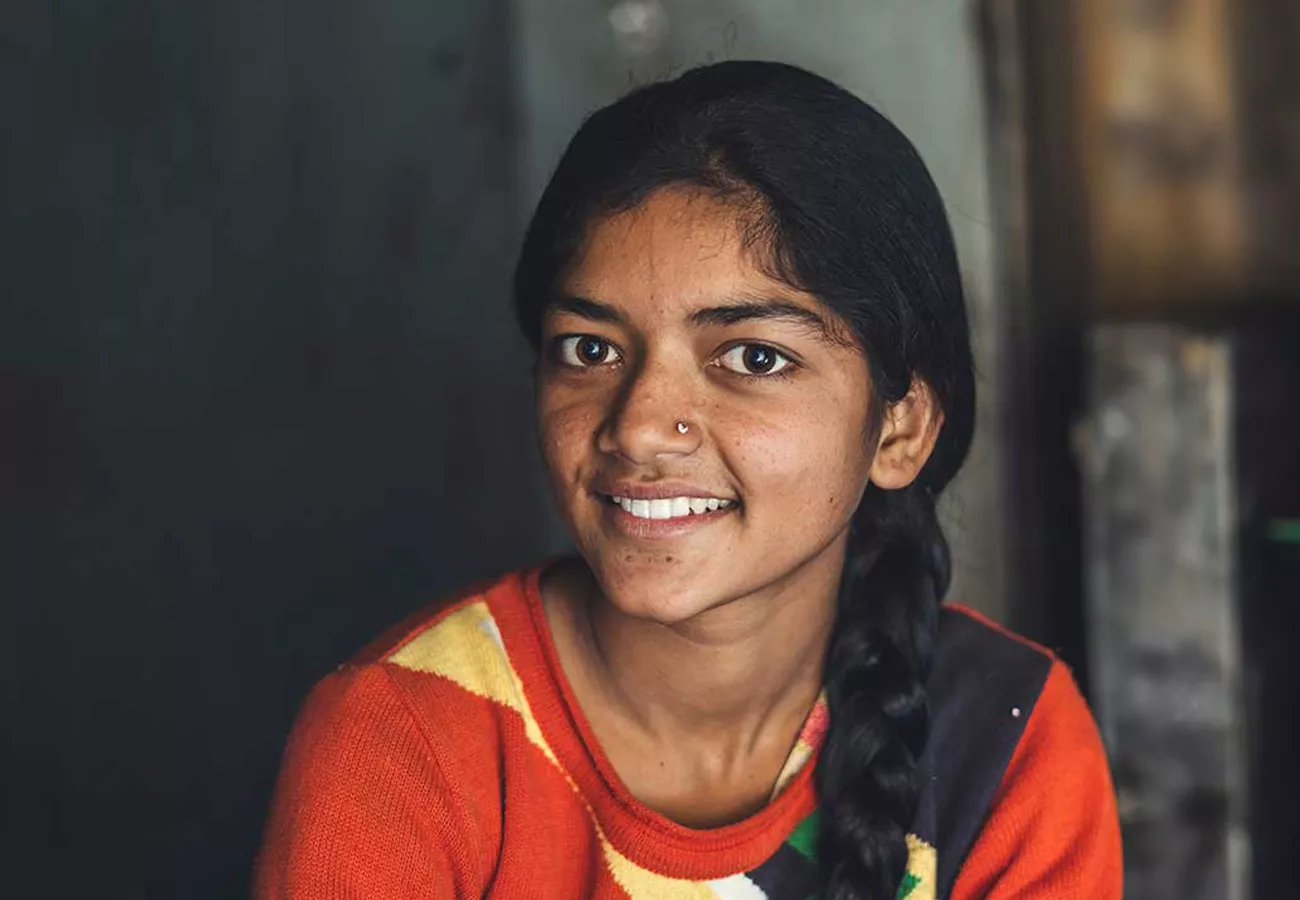
“The world was responding with soap and face masks and social distancing, but the women we spoke to were telling us they couldn’t eat or feed their kids. They couldn’t possibly quarantine, so listening to these women was very different than listening to ourselves,” says Emily Janoch, director for knowledge management and learning at CARE.
While the program had often provided aid at an individual or project level in the past, the widespread devastation of the pandemic meant that CARE had to respond on a massive scale—quickly. CARE needed modern data and analytics capabilities to provide global insights, so it invited Slalom and Microsoft to join the effort.
A common goal for the common good
Prior to COVID-19, CARE had explored creating a centralized data store that would alleviate the manual, time-intensive process of entering and reviewing data in spreadsheets. The pandemic lent a new urgency to the initiative, but financing was the first hurdle. As a charitable organization, CARE needed partnerships.
Microsoft provided licenses through its Tech for Social Impact program. Next, CARE needed data and analytics engineers. “Slalom has always been a key partner of Microsoft, and because I’d worked with the team and seen that expertise in the past, I felt very comfortable with Slalom’s understanding of data design, architecture, user experience, and capability building,” says Michelle Routh, former chief information officer at CARE.
Slalom assessed the requirements and use cases and established the foundational vision for a modern data architecture. We then presented the solution back to Microsoft, which, along with Slalom, made additional investments. “One of our Slalom core values is to build and shape a better future,” says Lauren Stark, a senior director at Slalom. “It’s been a fulfilling experience to partner with Microsoft in service of CARE to enable a better future for communities of women and children around the world.“
A worldwide workshop
During the three-week discovery process, a Slalom data and analytics lead conducted 14 interviews with 21 stakeholders in 13 countries across 11 time zones. Sessions were facilitated in French by a Slalom team member in Canada. Eight unique audiences were defined, from CARE’s central office to its field teams and the agencies that affect policy change. We asked users how, why, and what types of surveys were being conducted, what they were trying to achieve, and how best to present the data to facilitate their goals. Informed by those conversations, we designed a dashboard to layer in the data by actions, the business insights that enable those actions, and the data that drives the insights.
As more surveys came in, the team saw that both the data and the method of entry varied tremendously. Flexibility became a top priority, and the solution required a complex business logic that could accommodate a high degree of customization. Our goal was to create and streamline survey templates that would automate the incoming data, allowing CARE to better understand which resources were needed and where.
A build for a brighter future
The team decided that the Microsoft Power Platform suite of tools would allow them not to only build very quickly, but develop a solution that could be easily managed by CARE’s relatively small team. “Slalom jump-started our effort, establishing the much-needed capabilities we needed going forward,” says Cherian Varghese, director of data science and analytics at CARE.
Slalom specialists from all over the country developed the solution: a data engineer and a Power BI consultant from Atlanta, a Power Apps expert from Seattle, and an Azure expert from New York. We leveraged Power Apps to upload survey data and map responses to impacts, actions, and needs. The standardized data could then be aggregated, compared, and analyzed to discover the communities where help could make the most difference. We used Power Automate, Azure Data Factory, and Azure Synapse to load, process, and store the data, and then built an intuitive dashboard in Power BI to turn that data into actionable information.
Because the logic needed to map both numerical and narrative survey answers, data modeling was a challenge. For example, different versions of the same questions and answers might look like this:
- How have you been impacted by COVID-19? I had to start homeschooling my kids.
- Are you homeschooling kids between ages A) 1-5, B) 6-9, or C) 10-15? B
- Select 0 if you are homeschooling your kids. 0
Working closely and iteratively with CARE, we reviewed the data, ensured maps uploaded correctly, adjusted the business logic when numbers didn’t add up as expected, and accounted for different inputs. To ensure long-term success, Slalom advised CARE’s internal team on new hires and spent time on knowledge transfer to better enable them to support the system. “Slalom stands by our products. Even once we’ve handed over the solution, I’m still there to answer questions and continue to own this project for you. I’m not off the clock just because the build is complete,” says Adrian So, a data and analytics director at Slalom.
Data comes full circle
Habitasse platea dictumst quisque sagittis purus sit. Vulputate odio ut enim blandit volutpat. Ac odio tempor orci dapibus ultrices. Ipsum faucibus vitae aliquet nec ullamcorper sit. Varius quam quisque id diam vel quam. Gravida cum sociis natoque penatibus et magnis dis parturient. Praesent elementum facilisis leo vel fringilla est ullamcorper. Quisque egestas diam in arcu cursus euismod quis viverra. Posuere urna nec tincidunt praesent semper feugiat nibh.
Sed vulputate odio ut enim blandit volutpat maecenas volutpat blandit. Nunc lobortis mattis aliquam faucibus purus in massa. Dui id ornare arcu odio. Diam donec adipiscing tristique risus nec feugiat in fermentum. Quam adipiscing vitae proin sagittis nisl rhoncus. Feugiat in fermentum posuere urna. Senectus et netus et malesuada fames ac. Sem et tortor consequat id porta nibh venenatis cras. Sapien faucibus et molestie ac feugiat sed. Ut consequat semper viverra nam libero justo laoreet.


